In the past, I’ve shared some of the EduProtocol teaching strategies and templates such as the Iron Chef Non-Cooking Challenges, Thin Slides and the Amazing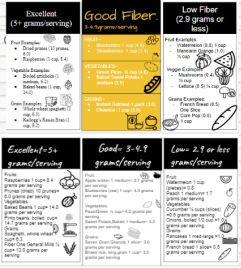 Race that were well received by students. Today, I want to share how I used the # Mania Infographic strategy with you. The Fiber-Full Food Choices: # Mania Infographic was created for use in my nutrition unit. This strategy incorporates technology and has students very engaged as there’s a lot going on simultaneously within small groups of students to create one infographic about fiber filled foods.
Set
- I begin be asking students what fiber is and why it’s important in our diet. A lot of students have heard the term but only a few actually know that it is a special carbohydrate that cannot be digested, but helps keep us full and rids our bodies of waste. In order to bring everyone up to speed I show this YouTube clip from HealthiNationFood to give an overview of fiber. After viewing I do expect them to be able to tell me what fiber does for the body, the two types, sources and the number of grams females and males need daily. Depending on my time, I may or may not have them fill in a video guide sheet. It’s included below in case you wish to use it.
- I also go over the numbers on the nutrition facts label as they pertain to dietary fiber. Explain that 5 grams or more is an excellent source, 3-4 grams are good sources and anything less than 3 is a poor source. Students will need to know this later so I have them add it to their notes.
- Since fiber comes from plant based foods, we are going to sleuth for levels in the Fiber-Full # Mania Infographic activity to figure out which are the excellent sources all the way down to the poor sources.
Materials
- iPads or Laptops
- Projector & Screen
- The EduProtocol Field Guide Book 2: 12 New Lesson Frames for Even More Engagement (affiliate link)
Activities
- Instead of students going out and crowdsourcing their fiber foods and numbers from all over the internet, I streamlined it and provided them the fiber chart resource I wanted them to use to help others make fiber full choices and linked it in Google Classroom.
- Students are placed into small groups of 3 and each person selects one of the below categories and chooses at least 6 food selections (2 fruit & 2 vegetables & 2 grains) with grams of fiber included to represent on the chart. Corresponding images and icons from the noun project only (you will need to create a free account using your school email) will be added as well.
- Excellent Fiber Sources= 5+ grams/serving
- Good Fiber Sources= 3-4.9 grams/serving
- Low Fiber Sources= 2.9 or less grams/serving
- Everything gets added to the provided Google Slide template in Google Classroom. Therefore, select a team leader to make a copy of the slide and invite other group members to the template (see below). Add text boxes, titles, foods with fiber grams and icons to your assigned section. Team leader submits to Google Classroom when finished.
- Once all of the fiber full infographics are turned in, students will complete the follow-up activity (found on the second page of the directions document), titled “Where’s Your Fiber?”. The infographics are assigned to different groups who use them to create one day’s worth of meals (breakfast, lunch, supper and snacks) based on their gender and fiber gram recommendations.
Attachments
- FIBER VIDEO NOTES (PDF)
- Fiber Chart (PDF)
- Fiber-Full Food Choices: # Mania Infographic (Directions & Follow-Up) (PDF)
- Google Slide Template (please make your own editable copy by clicking file, make a copy)
Similar Fiber Lessons
